Formerly known as Amazon Retail Analytics, Amazon Brand Analytic (ABA) is an add-on suite of additional reports which Vendors have access to through Vendor Central. The tool is exclusively designed to help any brand increase its advertising budgets and bids for those search terms/keywords. While the tool was earlier available to only Amazon Vendors whose pricing started at $30k, now it is accessible to every Brand Owner who has registered with its Brand Registry successfully.
What Is Amazon Brand Analytics Tool?
By definition, according to Amazon, Amazon Brand Analytics Tool is a feature that contains valuable insights to empower Brand Owners to make informed, strategic decisions about their product portfolio and marketing/advertising activities. It can be found under the Reports tab in Seller Central as this feature is only available to sellers who own a brand. This seller must be internal to the brand and responsible for selling the brand on Amazon.
With this tool, you can look for the following:
- Competitor insights
- Keywords that potential Amazon customers search for
- Identify your potential customers.
- Customers’ shopping behavior and their purchasing patterns.
- Most-clicked ASINs for a specific search term.
- Estimation of total clicks as well as conversions for every keyword.
What information is contained in the different types of reports?
Amazon Search Terms Report
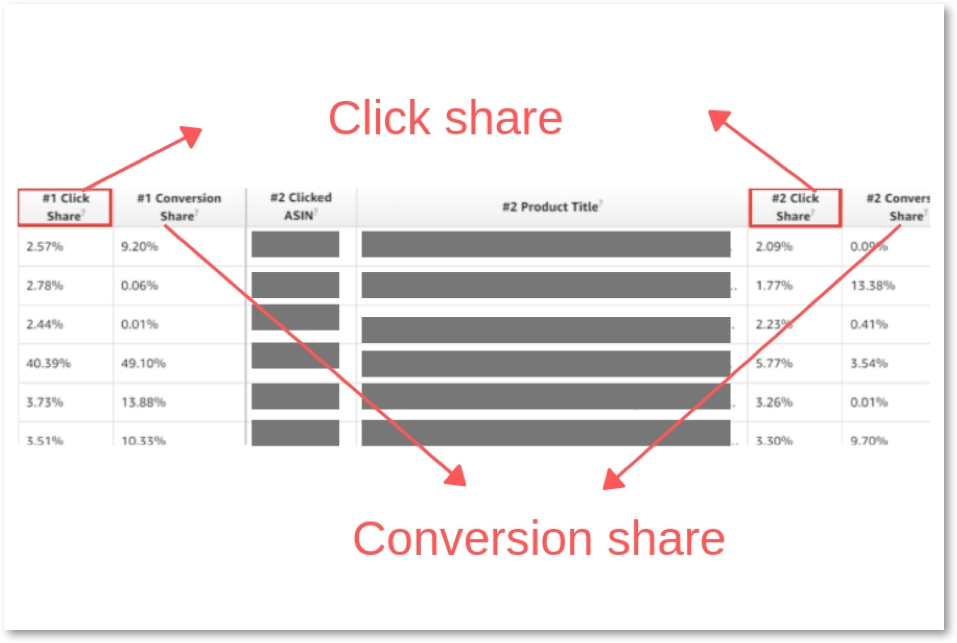
It shows brand owners how customers (in aggregate) find their and their competitors’ products in the Amazon store. The Amazon Search Terms report shows the most popular search terms in the Amazon store during a given time period, along with each term’s search frequency rank and the top three products that aggregate customers clicked on after searching that term. For each of the top three products, the report also shows each product’s click share and conversion share.
Click share (calculated in percentage) = No. of times customers clicked on a specific product for a search term / No. of times customers clicked on any product for a search term.
Conversion share (calculated in percentage) = No. of times customers bought a specific product for a search term / No. of times customers bought any product for a search term.
Source: SellerApp
Demographics Report
It shows Brand Owners the breakdown of their Amazon customers (in aggregate) by age, household income, education, gender, and marital status.
Source: Amazon
This information allows Brand Owners to assess the need for and success of targeted marketing campaigns and makes product portfolio decisions based on customer penetration by demographic. This report is only available in the United States.
Item Comparison Report
The Item Comparison Report shows the top five products most frequently viewed, along with the percentage of each product that was viewed, in the same day as the Rights Owner’s products during the selected reporting range.
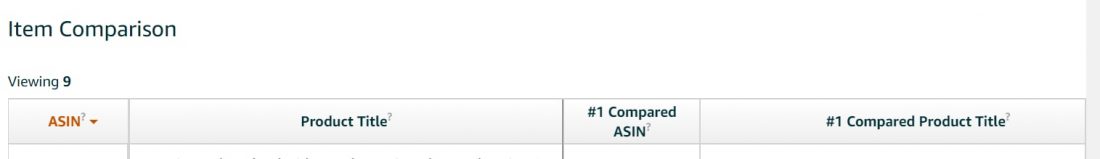
Source: Amazon
This allows Rights Owners to see directly competing products in order to make better-informed product portfolio and advertising decisions.
Alternate Purchase Report
It shows the top 5 products most frequently purchased instead of the Brand Owners products, along with the percentage of time each of the top 5 products was the alternative product of choice during the reporting range selected by the user.
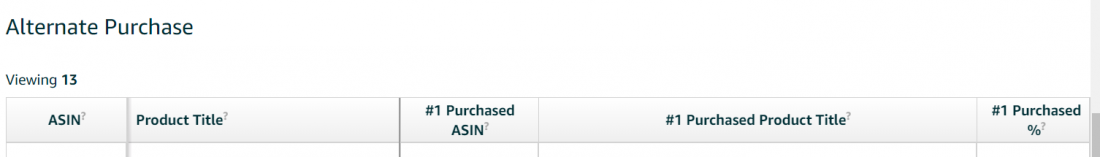
Source: Amazon
This allows Brand Owners to quickly see what products are most commonly purchased instead of their products to analyze product differentiation and portfolio mix opportunities.
Market Basket Report
The Market Basket report shows the top 3 products most frequently purchased at the same time as the Brand Owner’s products, along with the percentage of time each of the top 3 products was purchased with the Brand Owner’s products out of all products purchased with the Brand Owner’s products during the reporting range selected by the user.
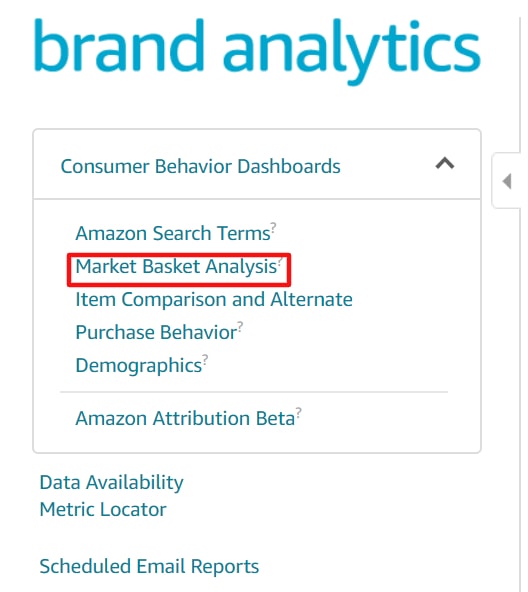
Source: SellerApp
This allows Brand Owners to quickly see what products are most commonly purchased with their products to identify bundling and cross-marketing opportunities.
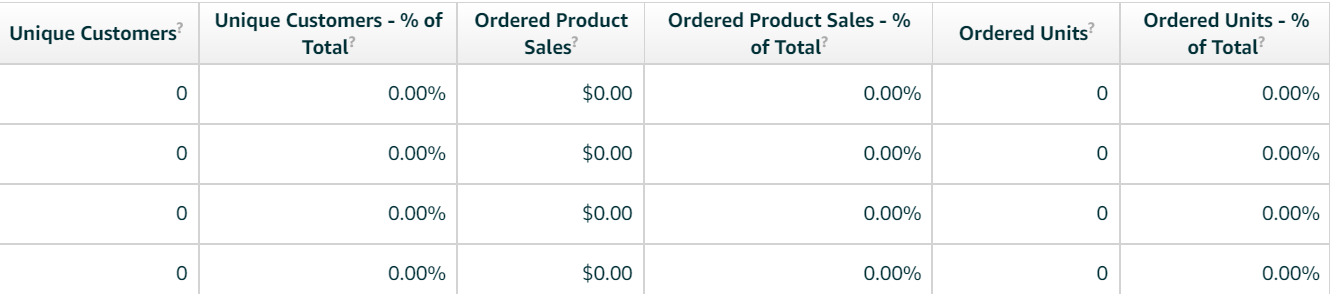
Repeat Purchase Behavior Report
The Repeat Purchase Behavior report shows Brand Owners the number of orders received for each of their products or brands and the number of unique customers who placed the orders. The Repeat Purchase Behavior report helps Brand Owners better strategize and assess their marketing campaigns to drive repeat purchases and acquire new customers.
What is the Eligibility Criteria For Amazon Brand Analytics?
To access the Amazon Brand Analytics tool, you should meet these eligibility criteria:
- Have access to Brand Analytics
- Be a seller on Amazon.com
Amazon Brand Analytics (ABA) is accessible to every 3P seller who is enrolled in its Brand Registry program.
How Does Amazon Brand Analytics Work?
As said earlier, Brand Analytics helps you give you some valuable data that you are looking for. Here’s what you quickly need to do:
Step 1: Select a specific date range from the dropdown list for viewing the report.
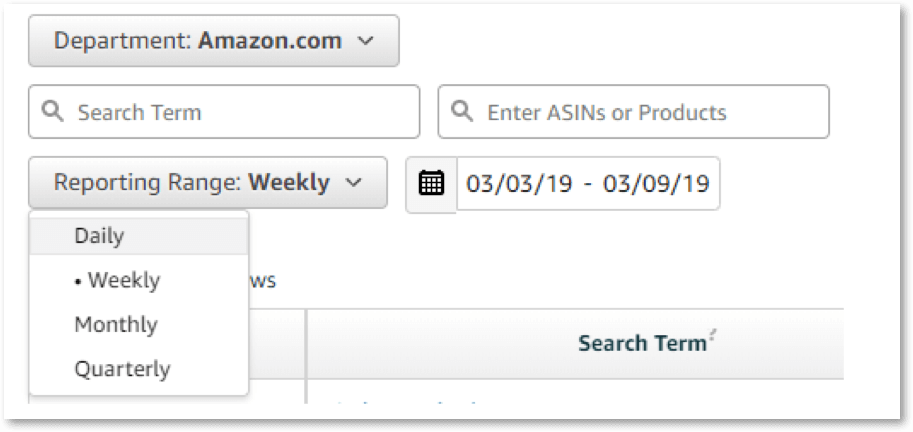
Source: Amazon
Step 2: Use related search terms/keywords, product names/Amazon ASINs in order to obtain relevant data.
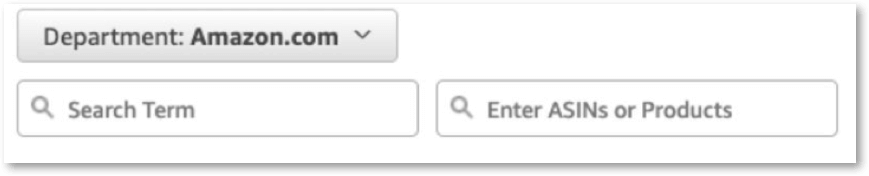
Source: Amazon
Step 3: Or, you can even specify your search criteria by clicking through the product departments.
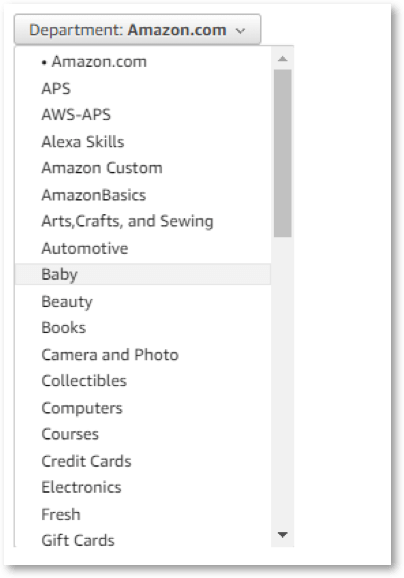
Source: Amazon
What are the benefits of Amazon Brand Analytics Tool?
Ever since Amazon has become one of the world’s biggest earning retail giants, there are more sellers signing up. With this, the competition is becoming steeper in most domains, and therefore, it has become crucial to have access to all your competitors’ data. This data helps incline your market share and build your brand bigger. There are various benefits of using this tool, and these include:
It is completely free
The dashboard of Brand Analytics contains some of the most valuable information, which if you want to access from any other tool, it will cost you a fortune. However, now that you are getting the data for free, why should you not utilize it? This feature is truly incredible because it contains all the essential information that you cannot find in any other data bank.
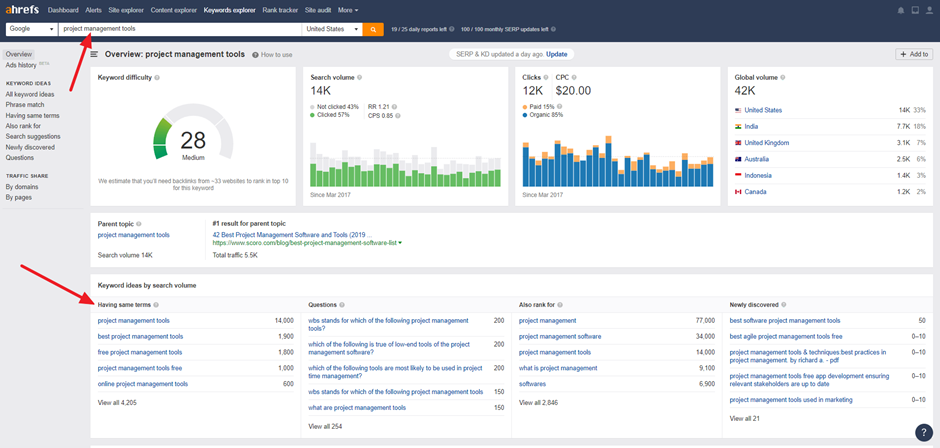
It helps you take potential keywords
Besides showing you some of the best data of your competitors and potential shoppers, this tool also helps you take good keywords. You can easily find this by having a look at the column named “search frequency rank.” It ensures that you pick the right keywords so that you can target your listings towards better organic rankings while optimizing for Amazon’s store.
It helps you with the right marketing strategies
When you have access to your competitor data and know exactly what they are doing, you will have a clear idea of where they are lagging and how you can bridge that gap to attract more customers to your product listings. This serves as an excellent marketing strategy to build your brand.
It is user-friendly
Well, you don’t have to be an analytics pro to use this tool. Amazon has designed “Brand Analytics” with a user-friendly interface. So, it is something that you can easily navigate and play with.
It gives deeper insights into your products
ABA helps you to recognize the search terms that drive sales. Therefore, you will exactly know your items more closely. Assume that own a sport shoe brand and people who purchase your product use the keyword “best sports shoes.” If you rank for the search term, it only means that your item is perceived as the “best” in your industry.
Conclusion
Since advertising is one of the wildly profitable and fastest-growing segments of Amazon, ABA is giving advertisers the necessary data to justify allocating more budget and better advertising plan on Amazon. While ABA is not a sophisticated keyword tool yet, however, it contains some valuable data, which you can utilize to make good business decisions. It is an ideal tool to check and perhaps, match up to your competitors’ strategies and best practices.